Monday 15 December 2014

Congestion Free Network (CFN) - 2020 Rough Order Costs

Today I'm going to get into some of the details for the Congestion Free Network (CFN) in the year 2020. With 2014 coming to a close we have 5-6 years to get this all built based on the plans.


CONGESTIONFREE.CO.NZ - 2014
In the 2020 map we have a number of new inclusions to the existing Rapid Transit Network (RTN) as follows:
  1. Northwestern Busway from Britomart to Westgate
  2. Upper Harbour Busway from Henderson to Constelation
  3. Central City Busway from Britomart to Newmarket via the University & Hospital
  4. Eastern Busway from Ellerslie to Puhinui via Botany
  5. Mt Roskell Branch line
With the exception of the Mt Roskill Rail line all of the above are grade separated busways similar to that of the Northern Busway. Note that it is assumed that the Northern busway has been extended from Akoranga to Britomart as a grade separated busway at some stage. The cost of this would likely be in the range of $1-2 billion however I wont include that at this stage.
WIKIMEDIA.ORG - 2014
Based on the CFN website the costs for these 5 projects are as follows:
  1. $250 million (17km)
  2. $200 million (19km)
  3. Free (5km)
  4. $700 million (20km)
  5. $150 million
So all up the cost of all this work is $1.3 billion which feels somewhat low.

For a quick comparison: The northern busway is just over 6km in length and cost $300 million to build in 2005 dollars. This work included a range of road upgrades at the same time which is likely to be required when converting existing roads to busways anywhere else in the city. If we choose to ignore any works at all on the disrupted roads we can say the busway cost $200 million which equates to roughly $35m per km including stations. If we use this value for the 61km of busway that is proposed to be built in the first phase of the CFN we are looking at a cost of $2.1b.

One big difference between the northern busway and the majority of these busways is that the northern busway was built on land that was already owned by NZTA & NSCC and therefore there was a rather massive saving. With the exception of about 10km of the Upper Harbour busway all of these busways require the purchase of all of the properties one side of the road from which they are to be built.

As a rough test on property cost it can be assumed that for every 100m of busway you will need to buy 5 properties, we will assume that 40km of the busway required property purchase and the remainder fits onto local roads or goes through parks that the council will handle over for free. Based on a $0.5 million per property we get a net property cost for these busways of $1b.

The above estimates are probably not too bad for most of Auckland city however there is one part we have missed and that is the CBD. Based on the 2020 CFN we have 3 busways feeding into the CBD which are grade separated all the way down to Britomart. We can certainly close off a few roads and reroute traffic however this is going to be no easy task and it certainly will cost a significant amount of money. As part of the CRL business case a bus tunnel was investigated that would generally provide for what would be needed here and it was priced in at $2.4b. That price does seem a little on the high side and I suspect we could get a similar result spending half that, however without further investigation I will use that value for now.

In summary, the busway portion of the works are expected to cost:
  • 61km of busway = $2.1b
  • Reinstatment of local roads = $1b
  • Property purchase = $1b
  • CBD busway works = $2.4b
Total cost = $6.5b.

So that's $5.2b more than the CFN estimate of $1.3b, given the total cost of the CFN is meant to come in under $10b there is some cause for concern here.

One thing I haven't taken into account yet is the Mt Roskill Branch line. This line is in luck in that NZTA has already spent a large amount of the money required and so we only have some 3-4km of track and two stations to build. The $150 million in the CFN budget isn't too far off the mark with 2 exceptions:
  1. The connection with the western line may need to be grade separated in order to provide for the 5min frequencies on the western line to avoid causing flow breakdown which will cascade into the CRL and therefore the rest of the network.
  2. The connection will require the purchase of the Pak'n Save supermarket which would add to the cost significantly potentially requiring a tunnel as mitigation.
If we are to add in the cost of the Mt Roskill Line along with extending the northern busway through to Britomart we are looking at a total cost of some $7-8 billion to bring the CFN to its 2020 vision. It seems in the case of the CFN we are sold a grade separated "Congestion Free" route when in reality what is priced for is really bus lanes on the side of existing roads which ultimately would be little different to that of existing in most cases.
streetsblog.org - 2014

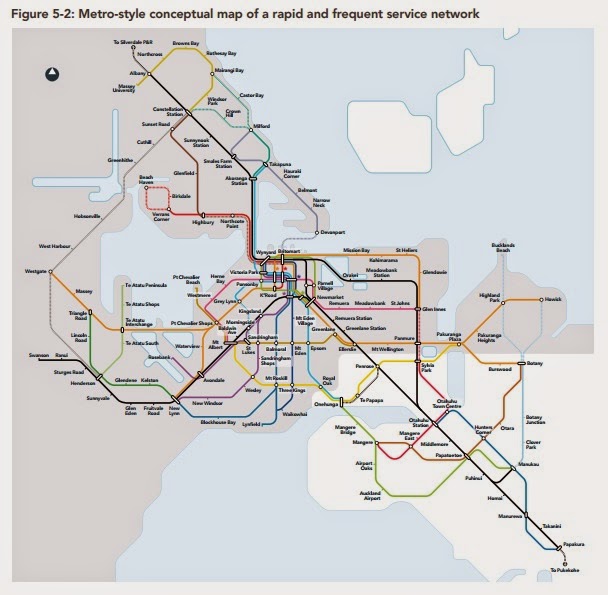
Based on these numbers I've created the following image that shows what could be built if we limit ourselves to the $1.3b budget as per the CFN. There are two risks here however, putting the busway through the westgate shopping centre could add another $0.5 million (approx)  and making the eastern busway fully grade separated may push the budget a little to far in order to get it all the way to Botany. Also note that I've added in the CRL which is another $2.4b.
2020 CFN - as priced

This has been a quick look at the cost of the 2020 CFN layout and is based on per km rates. Each of these routes will have specific issues and constraints that will need to be addressed with detailed design work and as such this has only been a rough order costing.

In future posts I'll look into some of these routes in more detail, such as the northwestern busway.


Thursday 11 December 2014

Congestion Free Network

Today I'm going to start a series where I look into the Congestion Free Network (CFN).

The CFN is a $10 Billion (approx) suite of projects that creates an additional layer on the transport system that is exclusively for the purpose of Public Transport (PT) built over a 17 year period. This system is to be highly integrated with itself and existing PT services creating a viable transport option over the majority of Auckland.

There are two key aspects to the CFN:
  • It is grade separated meaning that it is completely separate from the existing transport network and therefore is unable to be impacted by congestion or other disruptions.
  • It is high frequency with services being run at 5-10min intervals. It is assumed that the 5min frequency will be used during peak and shoulder peak periods with 10min frequencies off-peak or something similar.
Below is an image of a the Northern Busway which is an example of a grade separated PT link. Typically Rapid Transit Network (RTN) have greatly increased station separation reducing the amount of time spent waiting for other passengers.
TEARA.GOVT.NZ - 2014

Background:

Firstly, the CFN is a joint effort between 3 related lobby groups.
However the actual basis for the CFN is the Auckland Regional Public Transport Plan (ARPTP) which was created by Auckland Transport (AT) a year previously. Sadly AT and the various consultants that put many years of work into developing this plan don't get any recognition but rather ridicule for their work.
"Auckland's current plan is contained in the Integrated Transport Programme. This is both expensive and ineffectual - a road-heavy 'build everything' transport scheme that is currently unfunded."
No reasons are given as to why it is ineffectual but the bias against road transport is made apparent in the first sentence.

The two following images show the similarities between the two plans.

ARPTP - 2013

CFN - 2014
Comparing the two images 2 things are clear, the CNF is based off the ARPTP and the CFN doesn't include any of the frequent service network which is why it appears to be smaller.

Goals and Benefits:

The CFN is said to achieve the following outcomes:
  • Higher quality and better functioning city.
  • Cheaper and more effective then Integrated Transport Plan (ITP)
  • Improved air quality
  • Reduced carbon emissions
  • Reduced oil dependency
  • Improved urban form
  • Better public health outcomes
  • Maximizes value from existing infrastructure
  • Fit into efficient operating models
  • Unlock hidden capacity
  • Improve quality of place
  • Reduce road congestion
From the above list it sounds like an infomercial and one could expect the CFN to cut through boots, clean stains and make nutrient rich super smoothies. In reality most of these benefits are completely unsubstantiated and are simply generic sales terms to make the CFN sound like it's doing more than it is and to differentiate it from the ARPTP from which it was copied. There is no doubt that both the CFN, and therefore the ARPTP, have some great benefits but lets look at the list we have been given first.

Higher quality better functioning city:

This statement could very well be true however the issue is we have no context; what are we comparing things to? what makes the city higher quality, why is the city functioning better? what is the CFN being compared against?

In a way this is like claiming that blue is better than red, why? because it just is.

Cheaper and more effective than the ITP:

Half of this statement is true; the CFN is definitely cheaper than the ITP because it only builds a small fraction of it, however it's not clear as to why it would be more effective. The ITP was not developed because AT had a surplus of cash they wanted to dispose of but rather the city has a range of transport issues that need addressing. It's not possible to remove a series of critical transport projects from the ITP and arrive at a more effective outcome.

Improved air quality, reduced carbon emissions and reduce oil dependency:

The obvious rational behind this is that by having more people use PT will result in fewer cars and therefore fewer emissions and hence improved air quality. Unfortunately, many of the CFN projects will result in additional congestion along the routes which it is built by reducing capacity and rerouting trips along longer paths. By removing various projects from the ITP congestion in the city congestion will only be made worse and journey lengths increased, the CFN will makes things worse in some regards.

We also face the fact that modern cars are now very efficient and clean burning with electric and hydrogen vehicles making their way onto the market, come 2030 you will be able to by 20 year old electric vehicles and the majority of the fleet is likely to have zero emissions.

Improved urban form and improved quality of space:

This benefit really has no basis what so ever, the CFN will do nothing in any way shape or form in terms of creating improved urban form and improved quality of space and in some cases will make it worse, such as along Dominion Road were various communities stand in its way. What governs this is city planning and not the mode of transport. Neither a motorway or a busy railway line are the sort of things you want to sit next to and enjoy a quiet cup of coffee, however both of them can be used to provide access to a lake side or some other idyllic location.
NZETC.VICTORIA.AC.NZ - 2014
A common claim is that Bitromart precinct is a shinning example of what happens when you build a train station, however the reality is Britomart precinct would be little different be the train station located under it or located 800m down the road at the old train station. The old train station itself is a good example of this; it spent 70 years there including the time when 60% of Aucklanders traveled by PT,with the railway land around it being returned for redevelopment yet it never became a trendy location like Ponsonby.

Better public health outcomes:

This is another baseless benefit, active modes of transport such as walking and cycling are known to provide for health benefits but few would believe sitting on a bus or train is healthier than sitting in a car. You could argue that the improved air quality would aid in public health, however as noted above this is not likely to be much of an issue in the future vehicles will have few or zero emissions. The other potential area is that you are required to walk to or from the train stations, but the this is similar to when you drive that you need to walk to and from your car park.

Maximises Value of existing infrastructure:

This benefit is true in respect to the existing rail however in general the CFN does the reverse. For example, rather than keeping the busway it gets closed down and converted to a light rail line. For the existing road network, roads like Dominion Road and Te Irirangi Drive get downsized with their intersection capacities being reduced.

Fit into efficient operating models:

This is a straight sales slogan with no basis or detail to even comment on.

Unlock hidden capacity:

The CFN does increase PT capacity, there is no doubting this. However the term 'unlock hidden capacity' implies that something is being done for free, almost as if we have an entire rail network sitting waiting to go that just needs its power plug connected to a socket. In reality we are adding capacity with the CFN and paying for the privilege of doing so.

Reduce Congestion:

This claim is put in here for one specific reason, and that is to get road users to pay for the PT network, rather than the PT users. This is a common thing in that we all want everything for free, however if the CFN were built and required to fund itself in the same way that roads are you would likely be paying $20 rather than $5 a trip.

In reality the CFN will do nothing to improve congestion and in many cases make it worse, however it is claimed that there will be reduced road congestion and therefore the road users should pay for the CFN through the National Land Transport Fund (NLTF). If the CFN were so successful that it reduced congestion it would negate the need for it to be on its own network as both networks would be congestion free.

With reference to the image below, even with the busway in operation the northern motorway remains congested at peak times. This is great for the bus users but little different to the road users, the CFN will simply replicate this in other locations.
AT.GOVT.NZ - 2014
It may not be expected that the NLTF will pay for 100% of the CFN, however typically local projects such as PT systems are paid for with a 50/50 split, capital expenditure of the CFN's magnitude is well outside of the councils fiscal constraints and so its assumed a 90/10 split or similar is proposed with road users paying the 90% portion.

Summary:

So in conclusion what are the benefits of the CFN, well from my point of view we get the following:
  • an improved PT network
  • an isolated PT network that operates independently of the road network avoiding delays brought on by congestion and random events such as accidents.
  • an integrated PT network that has less reliance on going through the CBD
  • increased PT capacity
The net result of the above is that we obtain a greater range of choice in the way we travel to different parts of the city which reduces our reliance on the private car.

Based on the CFN website the grand cost of this whole new grade separated system is $10 Billion, this sounds like a bargain price if ever there was one however how close is it to reality.

For future posts I'll look into a few of the key elements and compare the estimates with the current build price of similar works to see how close to the mark the $10 Billion tag is.


Saturday 6 December 2014

Auckland Traffic Chaos

Yesterday, Saturday December 6th 2014, we had a little crash on the Auckland Harbour Bridge which resulted in 3 of the northbound traffic lanes being closed. This being being at around mid-day in the build-up to Christmas and the harbour bridge being one of the main pieces of transport infrastructure in Auckland resulted in a complete grid-lock for large parts of the central city and the motorway network.

NZHerald - 2014
So of course the question comes up, "Does Auckland need a better road network?"

Well it just so happens that this is one of the critical points on the Auckland motorway network that NZTA has known about for some time and hence they have been developing alternative plans for.

The first thing that NZTA has been doing is building the Western Ring Route (WRR) which is a complete alternative to SH1 through Auckland. If yesterdays crash happened in an Auckland where the WRR was complete we would have seen far less people being disrupted. We still would have seen congestion in much of the inner parts of Auckland as the WRR really does only provide for those going through Auckland or are living on the outer edges of the city.

The other project NZTA has in the works which is more directly related to this would have been the Additional Waitemata Harbour Crossing (AWHC). This project looks to replace the existing harbour bridges function as SH1 through auckland and leave the existing bridge to provide for local movements between the northshore and the city.

If we look closer at the AWHC it would have helped in 2 ways. Firstly the AWHC would be designed to a much higher standard in terms of road geometry and therefore it would be much less likely that the crash would have occurred at all. Secondly, had the crash occurred, either on the bridge or in the new tunnel, it would have left the other connection open and at full capacity.

Neither of the above 2 projects would result in there being zero impact, obviously when you loose 3 of the 4 northbound lanes on the only connection between the Northshore and the city you will get disruption. However, if these two projects were complete and we had this crash most of the city would not have even known or cared.

Moments like these we tend to get the various armchair experts coming out and expressing their opinion on what would fix the issue with one obvious call for better public transport. So one call we get is that if we had the Congestion Free Network (CFN) people would have been able to simply leave their cars at home and take the bus or the train to where they wanted to be. This of course misses the point, creating another isolated system doesn't create any redundancy or resilience but rather creates another layer where the same issue can happen again.

We actually see this currently with the existing motorway and rail networks.
When we have an issue on the motorway the motorway suffers and the rail network is fine.
When we have an issue on the rail network the rail network suffers and the motorway is fine.
In effect, the more layers you apply the greater the chance of having a failure, however the cost of that failure would be less as your usage would be more diverse.

So if we look at the rail side of things, one of the down sides of the Central Rail Link (CRL) is that we make our entire rail network dependant on the CRL being operational, all we will need is one breakdown or signal fault in the CRL and the entire rail network will need to stop, we have a similar issue with the electrification of the network.

So in terms of yesterdays event what would have it been like had we had the CFN? Well unfortunately with this being a weekend the likely result would have been very similar to what we saw, large amounts of congestion. The simple reason for this is that the types of trips people make in the weekend just aren't suited for public transport, of course some of them are however the majority aren't and this is why we see PT volumes taking a dive in the weekend whereas road volumes tend to carry on similar to that of a week day.


Thursday 13 November 2014

CRL Time Savings

For a little bit of Friday fun I've modified a rather nifty looking map for the CRL.

My image doesn't quite have the polish of the original but what it does is how how much faster the CRL will make trips for western line users to some of the key existing destination.

So the first image we have is the original which shows the travel times expected post CRL to Aotea Station. From the looks of things the CRL is some 20mins faster than the existing western line, which it is assuming you were previously taking the train to Britomart and then walking up to Aotea Square


In the next image I have modified the original to show the travel time saving each step of the way. As we can see the saving is generally nothing until you get to Mt Eden, from here it depends where you are going.

If you're going to Britomart you can shave 7mins off your trip taking the CRL, If you're going to Newmarket however you're looking at staying in your train seat for another 20mins, longer if you're going to Grafton Station.

Important to note here however is that you can easily change trains at either the new K Road station (depending on Mt Eden Links) or modified Mt Eden Station (Kingsland depending on the final form).

Depending on your luck you may have a seamless transfer and so it will only take another 5mins or so to get to Grafton or Newmarket. And depending on the weather you could always walk. If you have bad luck it could take another 10mins which isn't all that bad.

You also have the option of taking the Newmarket train (the one that doesn't go through the CRL), this means your train will be less frequent but when it comes it will be just as fast as the current train. 


To put this into the context of the existing travel times however, right now Mt Eden to Newmarket takes 5mins, post CRL we have a few options:
  • CRL route = 20mins, 400% longer
  • Mt Eden fast transfer = 10mins, 200% longer
  • Mt Eden slow transfer = 15mins, 300% longer.
  • Newmarket train + waiting = 5mins, no change but less frequent.
To finish off, lets not forget the CRL is not about improving travel times to Newmarket, its about improving travel times and capacity to the CBD. This is where the big benefits are and it's also where most of the customers are.


Wednesday 12 November 2014

What is Congestion

Back with a new post at long last.

I've been busy working on a number of major project tenders for the past few months but I thought it was time to create another post.

For this one I'm going to talk about congestion, what it is and how levels of it can be changed.

What is it Congestion

Congestion in its most basic sense is rather simple, its what happens when you get too many people doing the same thing. Congestion happens everywhere from on roads, inside a train carriage, along a railway line and even at the super market.

The initial effect of congestion is to discourage people from doing what they want to do. Each person has their own level of tolerance however the general rule is that the less congestion the better, unless your in a situation where congestion adds atmosphere such as a sports game.

From a transport perspective congestion makes your journey take longer and less pleasant. Even if the level of congestion doesn't make the trip take any longer levels of comfort are reduced, this is most evident systems such as trains and ferries where a user may choose to avoid traveling at a certain time to ensure they can have a seat on their own.

Another aspect of congestion is the interaction between other users and systems on your journey. For example, every intersection you go through on a journey results in a delay which adds to the level of congestion experienced and reduces the capacity of each approach at the intersection. This delay holds true for multiple form of transport such as road and rail systems and is the reason why we look at grade separation where they are high levels of interaction.

Impacts of Congestion

The two main impacts of congestion are longer travel times and the reduction of travel. Longer travel times reduces the distance an individual will travel which in turn reduces where they can choose to live, where the work, where they spend their money, what they do for recreation and how much free time they have.

The other impact is wasted time and lost productivity. The more time spent traveling the less time is spent doing what we are actually wanting to do, be it working in an office or relaxing on the beach. This loss of productivity does't just effect the individual but the community in general. When travel times are short and reliable we can build inefficiencies and greater levels of centralization.

For example, modern super markets are large warehouse sized developments that are able to provide lower prices by buying in bulk, minimizing transport and lower staffing costs. These developments are only possible by having a large throughput of customers. In order to have this they need to have either a densely populated catchment or a large catchment. If the transport network in the vicinity of the supermarket is too congested people will be put off from going to that particular supermarket and go elsewhere.

Reducing Congestion

Now that we know what congestion is, what happens when we try to reduce it.
To be in the position where you are trying to reduce congestion you would have to assume that congestion is a problem and therefore you are suffering from the impacts of congestion. In other words, people have already been taking steps to avoid the congestion themselves by choosing not to travel, traveling at different times, traveling on different modes or working/living in locations that aren't their first choice.

This means that when you do something to try and reduce congestion the improvement you make may result in these people coming back. This may give the impression there has been no change when in actual fact there has.

The most common place we see this is induced demand. This is often told as a phenomenon inherent with road construction and often used in a negative sense as an argument against road improvement. Induced demand however does not limit itself to roads but can go anywhere, it is simply humans taking advantage of the options they are given.

This then brings us to the question, is congestion the problem that we need to address or is it something else. We can certainly reduce congestion, we can put other disincentives on the transport system so that people don't want to use it, we could add so much capacity that everyone can use it all at once. But with finite resources and a desire to have a city that is not defined by its transport system means these aren't really an option.

This is what I will look into with my next posts.


Saturday 26 July 2014

Traffic Volumes - Part 2

To carry on from my previous post, I'm going to look at how the currently proposed crossing could operate in terms of capacity and diversity. For this I will again be using the values from the 2010 study located in the Transport and Traffic Model Report.

For a quick summary, the predicted demand across the harbour are as follows:

2008 = 168,150 vpd
2026 = 197,830 vpd
2041 = 205,200 vpd

Traffic Modelling

For a quick note on how these volumes are arrived at:
These volumes come from a regional traffic model that takes into account a large number of assumptions such as land use changes and public transport. The model is not all that detailed on specific elements, such as does this left turn have a pedestrian crossing, but takes a look at the big picture and the general capacity and demand on a system and so on a macro scale is very detailed. When new capacity is added to the model, such as a new harbour crossing, not only will the traffic distribution change but so does the demand due to the potential for trips being increased.

So using the 2010 Study we can see how the travel over the harbour changes with the increase in capacity. Note that these values are the expected AADT and not the demand, even with the new crossing there are still plenty of constraints on the system in other locations and so we will still have demand in excess of capacity.

2008 = Existing Bridge = 168,510

2026 = Existing Bridge = 95,590
2026 = New Crossing = 134,100
2026 = Total = 229,690 (16% more demand)

2026 = Existing Bridge = 110,070
2026 = New Crossing = 144,240
2026 = Total = 254,310 (23% more demand)

Induced Demand

As you can see, the new crossing has enabled a large number of increased trips over the harbour, 23% or 49,110 more each and every day. Comparing demand and actual volumes we can see that the repressed demand, or demand that can't be provided for, is reduced from 18% to 13% which is a sizeable change.

So what you have seen here is induced demand; in the existing situation the shortage in capacity results in trips not occurring, when the capacity is increased the congestion is reduced which in turn enables the repressed trips from before to come out and join the system which in turn increases capacity. 

In a way you can think about it like the apple display at the fruit store. When the display is full of nice juicy apples everyone who thinks about getting an apple will likely grab one. Once the display starts to get low and only the less desirable apples are left people will think twice and maybe decide they don't want an apple. Eventually you will run out of apples and no matter how desperate someone is to get one they simply can't.

In a large city the transport system is very similar to this fruit stand as it's simply not practicable or financially feasible to provide a system that can provide ideal conditions for everything and everyone all hours of the day. So when you put a few more apples in the bowl or upgrade a road the large number of people who have been held back will quickly take up the new supply.

This brings us into a bit of a debate about how much road capacity should be provided. Although road travel by private car can be very convenient and pleasant, when it comes to large volumes of commuters significant dis-benefits arise making it less ideal. In my view, this is where we need to think about what we do with the existing bridge if a new crossing is built.

New Crossing

With the new crossing we get the following peak hour traffic volumes:

2026 = 5,300 (actual), 6,260 (demand)
2041 = 5,300 (actual), 6,440 (demand)

Capacity = 3 x 1800 = 5,400

Existing Bridge With New Crossing

Next we will look at how much traffic will be using the existing bridge after a new crossing has been built.

2026 = 5,430 (actual), 6,390 (demand)
2041 = 5,800 (actual), 6,320 (demand)

From Appendix G of the 2010 Study the existing bridge has been modelled with 5 general traffic lanes, 3 in the peak direction and 2 in the counter peak direction. 1 of the existing lanes is handed over for active modes and another 2 given to buses.

What isn't clear here is how these lanes are arranged, and so it's hard to know what the capacity of each route actually is therefore I wont comment further on the arrangement in the report.

Future Layout

In terms of the bridge layout I'm going to refer to what could happen which continues on from my Victoria Park post. For this, the idea is to reduce the footprint of the existing motorway through St Marys Bay so that more of it can become open public space as seen below.


Turenscape.com
In this layout I propose to make the existing bridge 2 lanes each way for general traffic with this traffic using two existing clip-ons. The central span would then be converted to provide a single lane in each direction for buses and freight with something like the Skypath being added for active modes.

This would end up being very similar to what is currently proposed for the Pakuranga to Botany Busway and would extend along Fanshawe St into the CBD. 
Auckland Transport - 2014

So how does this work traffic wise?

Well when using the clip-ons the lanes are nice and wide so we can expect full utilisation.

2 x 1,800 = 3,600 vehicles per hour (vph)

Compare this to the current 3 median lanes during peak hour where the shy-line effect reduces the capacity of the lanes.

3 x 1,440 = 4,320 vph

Those 3 lanes are including freight however, if we assume a low number of 5% given most freight will be taking the new crossing we have 4,104 vph.

What you will notice here is that in my proposal we have 12% less capacity for general traffic over the harbour. The question to be asked here is; is this what we want?

If we refer back to the network layout we see that the existing bridge provides for people travelling to or from the north into the CBD and Ponsoby. From my perspective we don't really want large volumes of people driving to these destinations, neither of them have much scope to handle any additional vehicle demand but would greatly benefit from improved PT and less private vehicle traffic. To this extent I'm not really too worried about there being less vehicle capacity over the existing bridge and through St Marys Bay when you look at the benefits that come through doing so.


NZTA - 2010

Summary:

So when we look at what a new crossing could mean for traffic volumes and people moving over the harbour we get given a few questions and options. Certainly the new tunnel provides for those long distance trips that are not wanting to go into the CBD itself but what do we do with the existing bridge. We have the option here to downsize the private vehicle demand and turn some of the road space over to open public space, or we can leave the roadway as is and let people chose how they travel to the CBD.

If we refer back to the traffic modelling, the tested scheme results in 23% more demand on people wanting to travel over the harbour using both the tunnel and the existing bridge due to the improved access. Of that 23% however, how many more do we want driving to the CBD?

Monday 7 July 2014

AWHC - Traffic Volumes

To continue my series on the Additional Waitemata Harbour Crossing (AWHC) I'm going to have a look at the traffic volumes and potential lane configurations such a project could bring.

Project Layout

Based on the 2010 study I am going to assume that the the project will consist of two 3-lane tunnels which will take over the function of SH1. These tunnel will run directly from the Central Motorway Junction (CMJ) through to Northcote Point. For additional details you can view the 2010 study drawings here.


Auckland Council - 2014
One of the interesting aspects of the current designs for the AWHC is that the cross harbour traffic flows are split to provide for two separate functions. The new tunnel provides for north/south movement through the city and bypasses the CBD with users wanting to go to the CBD and Ponsonby taking the existing harbour bridge. The big benefit of this is that traffic travelling long distances on the motorway network are not forced to mix with commuters making short trips over the harbour to the CBD.

The following image comes from the 2010 study showing the routes each crossing provides for.


NZTA - 2010

Anyone familiar with Auckland will know that the existing bridge is rather large with 8 lanes in total with a movable median barrier enabling the bridge to operate in a 3/5 configuration to provide for the tidal peak flow. 
Stuff - 2011

With the new crossing in place we no longer need this level of capacity provided over the existing bridge and so we are presented with an opportunity to reassign the space on the bridge to serve different priorities.

Traffic Volumes

In terms of traffic volumes I am going to use the 2010 studies volumes.

The important thing to note when looking at the AWHC is that we currently have two crossing, the existing Auckland Harbour Bridge (SH1) and the Upper Harbour Bridge (SH18)

As a base line we get the following volumes:
Annual Average Daily Traffic

2008 (AADT)
SH1 = 168,150
SH18 = 27,160
Total = 195,000

2026 (AADT)
SH1 = 197,830
SH18 = 78,260
Total = 276,000

2041 (AADT)
SH1 = 205,200
SH18 = 80,500
Total = 286,000

What's not shown above but is in the report is that a large part of this growth is expected to come from increased inter-peak volumes. Currently inter-peak traffic is about 60 to 70% of the peak hour traffic flow, this is expected to increase to 80% in 2026 and 90% in 2041 meaning you can expect peak hour conditions for pretty much most of the day.

Something else that isn't shown in the above is the demand; if you're a commuter you will likely have experienced driving on a congested road and there have likely been occasions where you have taken a different route or mode in order to avoid the congestion.

Taking the existing harbour bridge as an example, the morning peak in 2008 experienced 7,640 vehicles per hour (vph) in the southbound direction, however the demand for this link is 18% more than this at 8,980 vph. So from that we have 1,340 vph that are either taking a different route, not making the trip or have changed to another mode.

Capacity

If you're someone that lives on the Northshore and commutes over the bridge in the morning you will likely know that the bridge itself seems to flow somewhat smoothly. The following numbers list the capacity of the roads that feed onto the bridge and then the bridges capacity, as you will note the connections to the bridge act as constraints leaving some residual capacity on the bridge. 

Northern Motorway 3 x 1800 = 5,400
Esmonde Road 6s Signal Time = 1,200
Onewa Road Signal Intersection = 1,000

Total Inflow = 7,600

Bridge Capacity = 5 x 1800 = 9,000

One thing I haven't taken into account above is the affect of thee narrow lanes on the bridge. Currently the clip-on lanes are 3.5m in width which is fine for 1,800 vph however the lanes on the central span are just under 3.0m in width and this reduces their capacity by 20% to 1,440 vph. This reduction in lane capacity comes from something called the "shy-line" effect. Most people who drive over the bridge will know that tight feeling of travelling in the central lanes and the "shy-line" effect is the technical term used; this has the impact of people driving slower, increasing vehicle spacing and shying away from objects such as barriers which then impacts the next lane over.

For some technical reading on "Shy-Lines" Section 6.2.1 of the SHGDM gives a few details.

If we reduce the capacity of the central 3 lanes to 1,440 vph we get a total capacity over the bridge of 7,920 vph, this lines up quite well with the 2008 volume of 7,640 vph crossing the bridge which suggests that only a small increase in traffic volumes would result in flow breakdown and congestion on the bridge.

Conclusion

So in conclusion we have:

  • Current traffic volumes put the peak hour near capacity
  • The existing connections hold back traffic to prevent the bridge from getting over capacity
  • The existing crossing is unable to provide for the current demand with 18% of trips being lost or diverted.


Given this post is getting somewhat long I'll leave talking about the new crossing and how the volumes play over in the next post.

Cheers


Saturday 28 June 2014

AHWC - Victoria Park

Today's post is going to start a sub-series on what we can expect, hope or desire for if there was to be an Additional Waitemata Harbour Crossing (AWHC).

To start with a disclaimer; everything I'm about to say are simply my thoughts an ideas, the AWHC is still very early in it's design stages and so the actual form of the project is largely unknown at this stage. My thoughts are going to be based on the design drawings from October 2010.

For this particular post I am going to focus on the southern side of the proposed including Victoria Park, St Marys Bay and Freemans Bay. The image below shows the area in all it's glory back in 1959 just after the Auckland Harbour Bridge and Victoria Park Flyover were opened. For some history of the area, back in 1870 there was no Tank Farm and Victoria Park itself was a bay with what are the Victoria Park Markets today on the foreshore. 


Auckland Council - 1959
Jump 45 years into the future and things weren't all that different, St Marys Bay had been further reclaimed, a marina had been built and marine related light & heavy industry have been beavering away along with the petrochemical industry.

In the past 10 years there has been quite a notable change, with the successful redevelopment of the viaduct area and the growing CBD, the heavy industry has all been pushed out and the expensive process of decontamination and redevelopment of the Tank Farm has seen a rather large change to the area.

One thing that hasn't changed to much is the large viaduct that goes through the middle of the park. Now 55 years old this structure has been a feature in the park for pretty much half of it's existence. At first impressions you could point to it and call it a relic of the motorway age, the time when the focus was to get cars moving no matter the cost. Certainly when I went down there to take some photos I already had the opinion in my head that it would be a dark depressing environment with the noise of vehicles rumbling overhead.
Transport Logic - 2014
Strangely however, once you're down there you can see that it actually serves another rather important function, that being a protected corridor from one side of the park to the other. Currently if you're an office worker at Wynyard Quater and want to go for lunch at the Victoria Park Markets on a wet day you can pretty much guarantee you will take this route under the flyover rather than staying out in the wet. Admittedly the northern end is rather average and turns into a carpark however this raises a question, how will we replace this facility when we remove the flyover?

Ironically, when I was down there most of the non-vehicle activity was right next to the motorway flyover, to one side the new skate park that was built as part of the Victoria Park Tunnel (VPT) was positively overflowing and on the other side there was a bunch of people playing rugby, all the while pedestrians and joggers were running under the bridge. Now I'm certainly not saying these people wouldn't be there if it wasn't for the flyover, it was more than I was rather impressed to see how negligible the impact of the structure was on the users of the park.

Something else I found rather interesting was the level of noise coming from the flyover, it's by no means whisper quiet but it was sort of hard to say which was worse out of the flyover or the local roads. For the flyover you hear the constant whoosh coming from vehicle tyres on the wearing course of the bridge, however for the local roads you hear the green light drag race every time one of the 5 sets of traffic signals changes. When I was down there it was a Sunday morning and traffic on the local roads was rather light, however I'd image that during the working week when there are notably more vehicles I'd say the local roads would put the flyover to shame in terms of noise production. One thing to note here is that the noise from the flyover could easily be greatly reduced, if the current steal handrails on the bridge were replaced with concrete barriers this would send most of the noise directly up into the atmosphere rather than laterally into the park.

Transport Logic - 2014

Transport Logic - 2014
One thing I think most people would agree on is that the park would look better if there were no bridge, the two images above give you the basic idea of what you can expect, one with the flyover and one without. This is where the AWHC comes in as part of the proposed project is to remove the flyover. Take note here that I am not saying that the only thing the AWHC does is remove the flyer, I'm just saying that this is one of the many parts of what would be a $2-3 Billion project.

The place where I see real potential for change however is through St Marys Bay. Currently we have one massive section of road, the reason why it is so wide is not just because we have large volumes of traffic moving through here but it's also the fact we have a number of on/off-ramps with quite complicated horizontal geometry.
Transport Logic - 2014
Now just imagine; if we are going to be removing about 60% of the traffic and sending it through an underground tunnel, and we also remove the various ramps connections that add to the current complexity we could put this section of road on quite a large diet which would free up a large amount of land right on our foreshore. The question is, what do we do with that land?

The following image is a before and after image in Boston which was done as part of "The Big Dig". Now that is the sort of change I would like to see along St Marys Bay, and in my mind well worth $2-3 Billion.

Turenscape.com